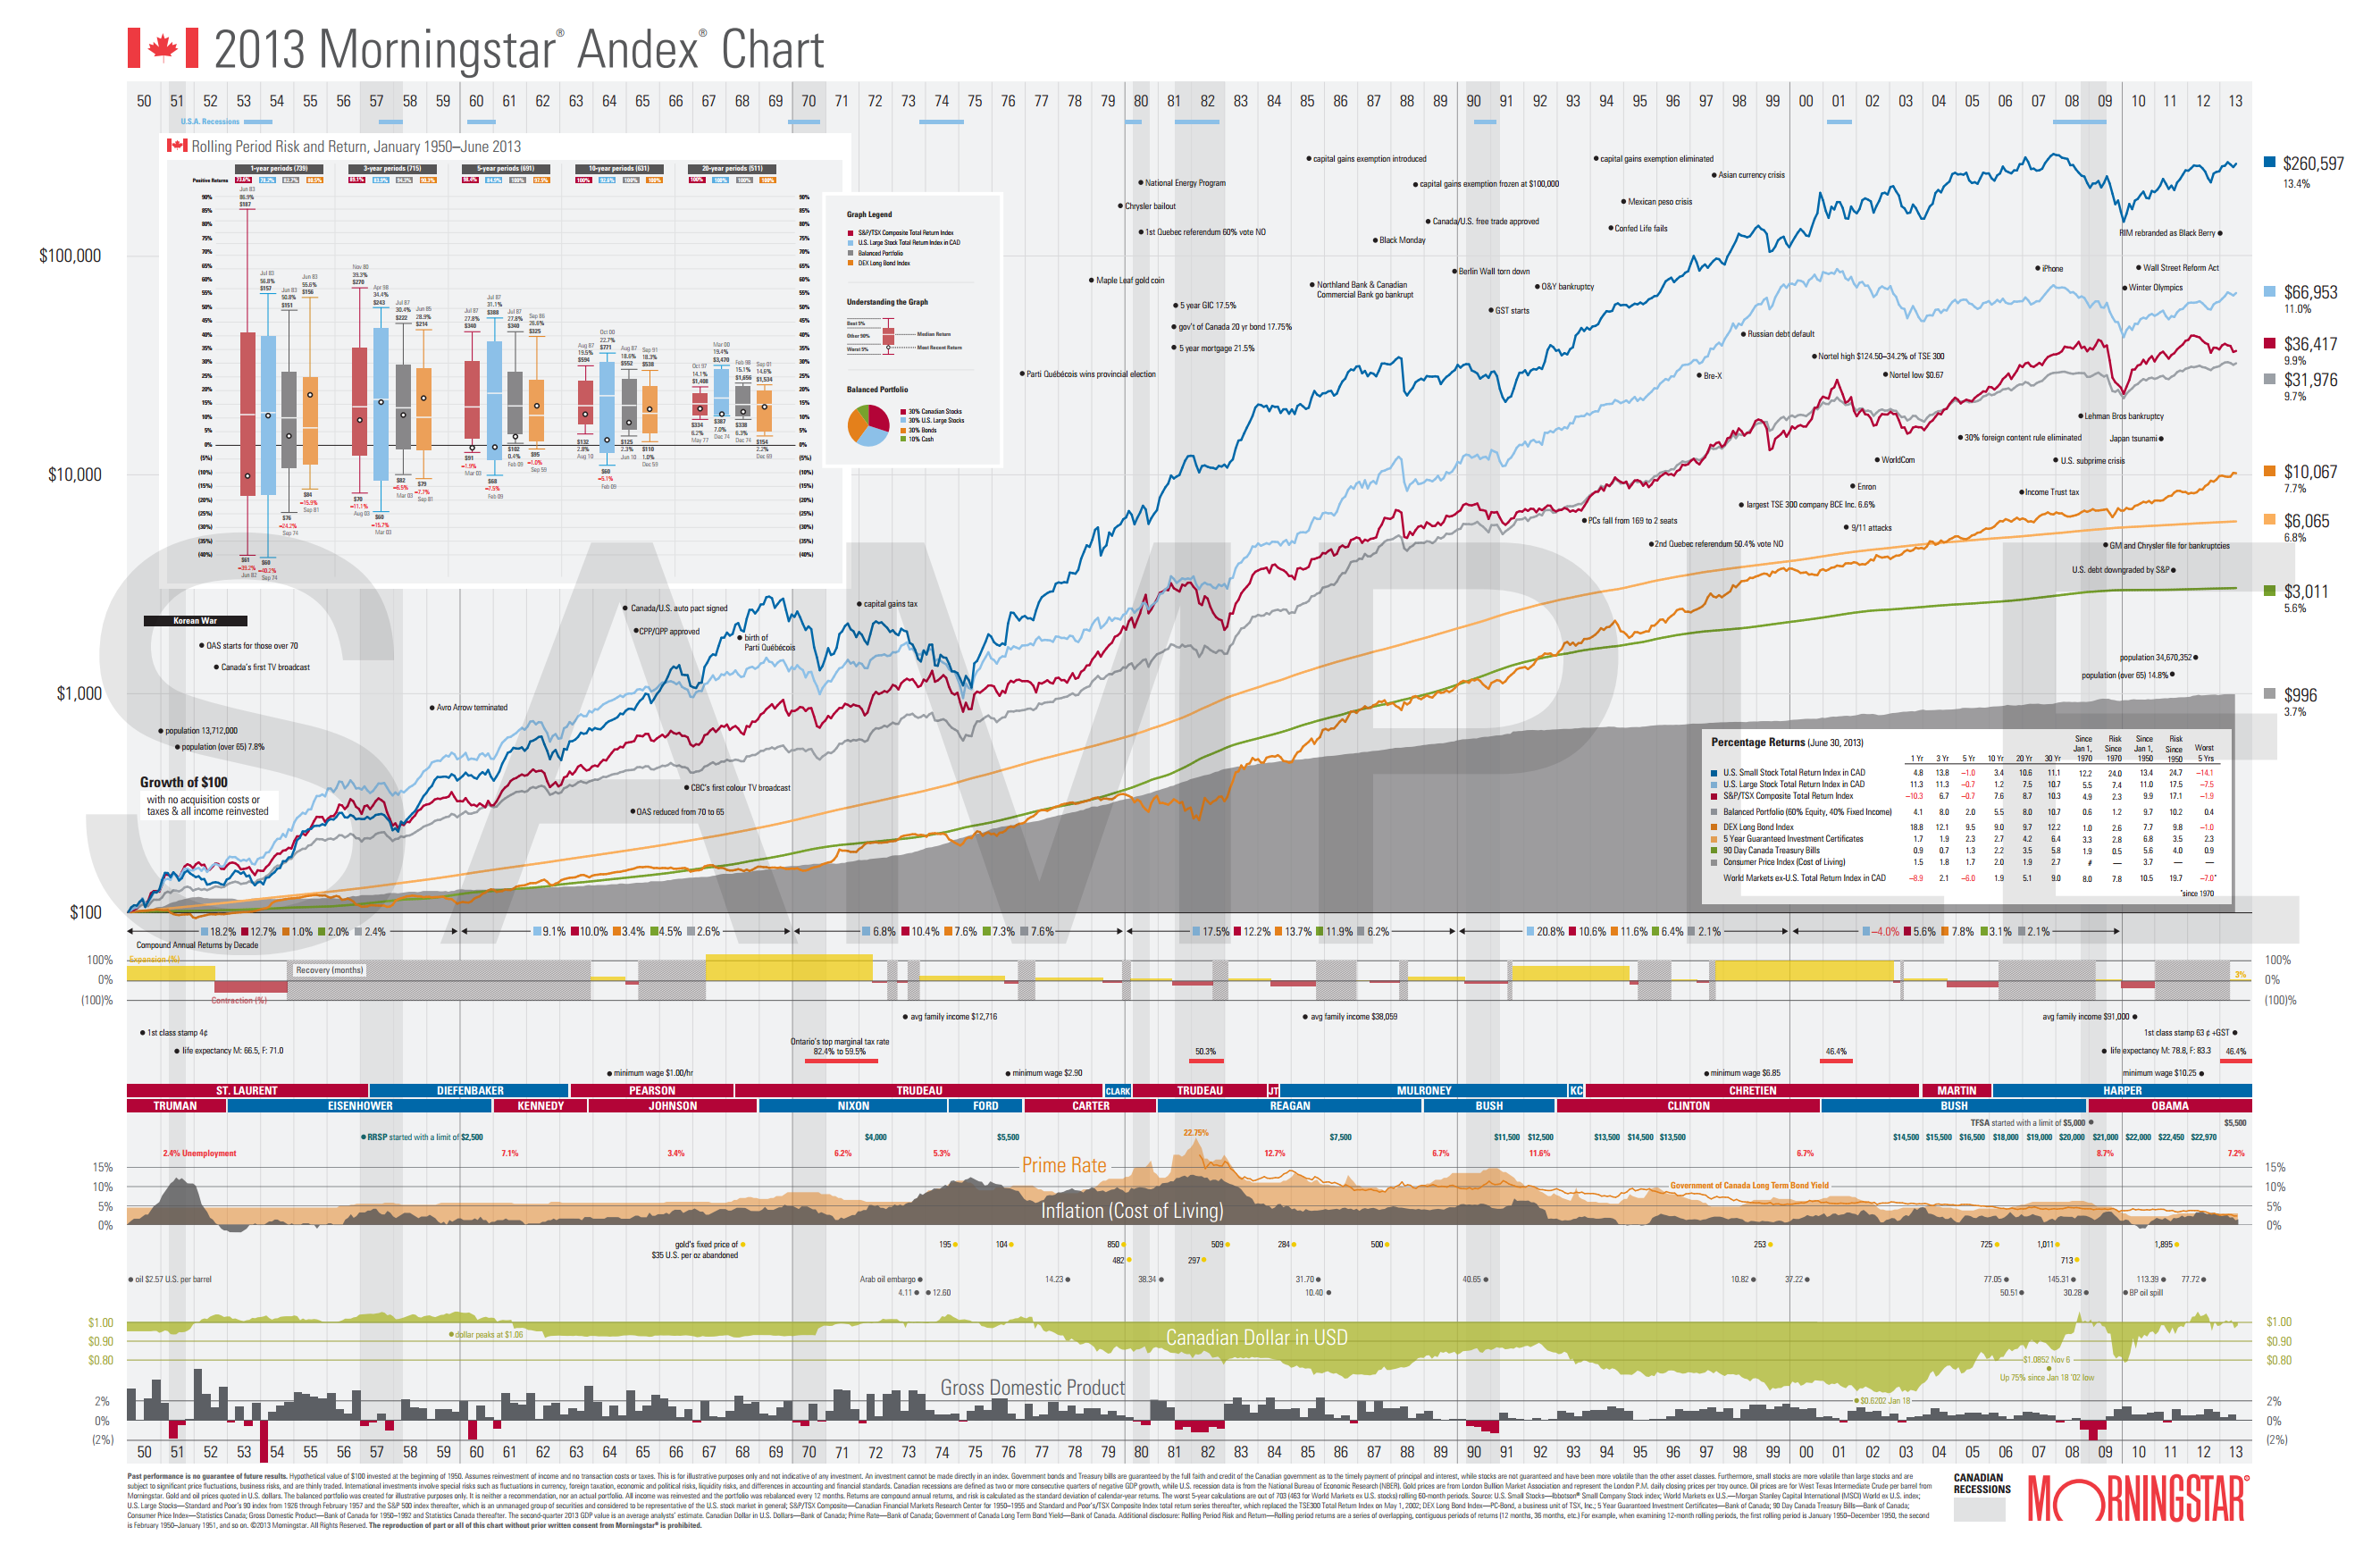
The $100 Chart
2015-04-26
Had a conversation with a friend tonight about investing. Everyone should check out this chart, which shows the growth of a hypothetical $100 investment in 1950, tracking various securities. Note that it’s a logarithmic chart. Also note that inflation means that the initial $100 investment would be more like having invested $1000 of today’s money. There are many, many takeaways from this, but key are that over the long haul, the more volatile high-risk options do tend to pay out much better, but also that it can take several years to a decade to turn a profit during the worst recession periods. If you are saving for a purchase in the next few years - a house, car, wedding, dream vacation, etc. - you’re considerably safer investing in bonds and GICs. If you’re saving to retire in 20+ years, there’s basically no doubt you should be investing in relatively high risk securities like stock market index funds. If you’re counting on your 1% savings account interest, you’re literally becoming poorer every day as inflation means your savings are worth less and less.